Performance Reports
Linaro Performance Reports and darshan
Linaro Performance Reports may have undefined behavior when profiling an application that has been linked against the I/O characterization tool darshan. Unload the darshan module and recompile the application to workaround this issue.
Linaro Forge sampler's CUPTI error message on CPU nodes
When MAP or Performance Reports is used on CPU nodes, multiple lines of the following message can appear:
Linaro Forge sampler: CUPTI failed to enable kernel activity monitoring - error code 15
This message on CPU nodes is benign and can be ignored. It can be suppressed with the command:
export FORGE_SAMPLER_DISABLE_GPU_PROFILING=1
Don't set this on GPU nodes.
Introduction
Performance Reports, part of the Linaro Forge (previously known as Arm Forge or Allinea Forge) tool suite, is a low-overhead tool that produces one-page text and HTML reports summarizing and characterizing both scalar and MPI application performance. The report intends to answer a range of vital questions:
-
Is this application optimized for the system it is running on?
-
Does it benefit from running at this scale?
-
Are there I/O or networking bottlenecks affecting performance?
-
Which hardware, software or configuration changes can be made to improve performance further?
The tool is based on MAP's low-overhead adaptive sampling technology that keeps data volumes collected and application overhead low.
The Forge User Guide available from the official web page or $ALLINEA_TOOLS_DOCDIR/userguide-forge.pdf is a good resource for learning more about some of the advanced MAP features. The variable ALLINEA_TOOLS_DOCDIR is defined by the forge module.
Loading the Forge Module
To use the Performance Reports tool, simply load the forge module to set the correct environment settings:
module load forge
Compiling Code to Run with Performance Reports
To collect performance data, Performance Reports uses the same sampling method as MAP. The same build and link rules as with MAP apply here. For info, please check Compiling Code to Run with MAP or the User Guide.
Starting a Job with Performance Reports
In order to use this tool, you do not have to run your application in an interactive batch job session. Just make sure that the module is still loaded in the batch session (that is, in your batch job script if you use the tool in a non-interactive batch job):
module load forge
Add a command that launches the tool:
perf-report srun <usual srun flags> ./jacobi_mpi
where ./jacobi_mpi is the name of a program to profile.
Profiling Results
After completing the run, Performance Reports prepares performance summary results in two files, one plain-text file and a HTML file: executablename_#p_#n_yyyy-mm-dd_HH-MM.txt and executablename_#p_#n_yyyy-mm-dd_HH-MM.html where # before the letter p is for the process count, # before the letter n is for the node count, and yyyy-mm-dd_HH-MM is the time stamp. For example:
$ ls -lrt jacobi_mpi*
...
-rw-r--r--   1 elvis elvis   476702 Jun 28 08:40 jacobi_mpi_8p_2n_2019-06-28_08-39.html
-rw-r--r--   1 elvis elvis     3092 Jun 28 08:40 jacobi_mpi_8p_2n_2019-06-28_08-39.txt
The performance results in both files are basically the same. If you want to use a web browser for a better display, download the HTML file to your local workstation and view it with your favorite browser.
The top portion of the report shows the command that was run and info about the compute nodes, followed by a performance characterization of the application run - whether it is a compute, MPI-communication or I/O bound:
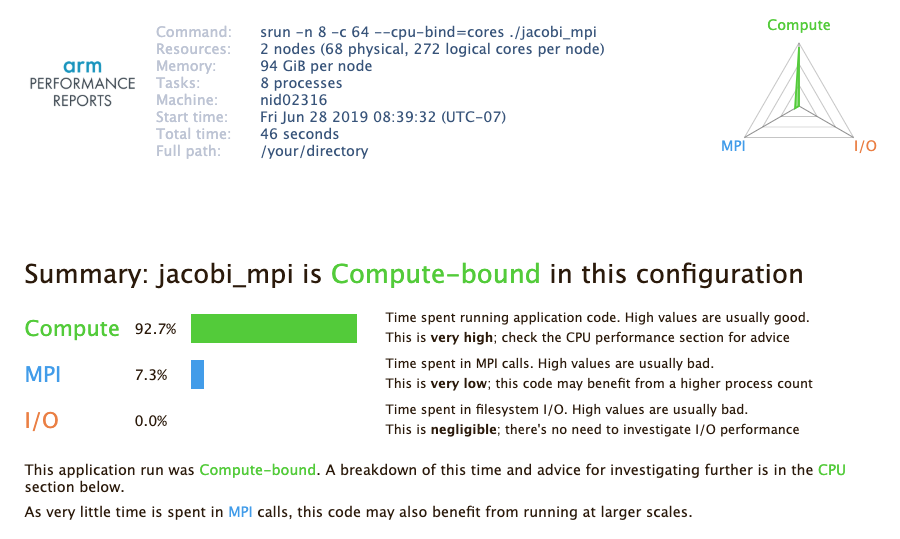
The triangular radar chart in the top-right corner of the report reflects the values of the three key measurement.
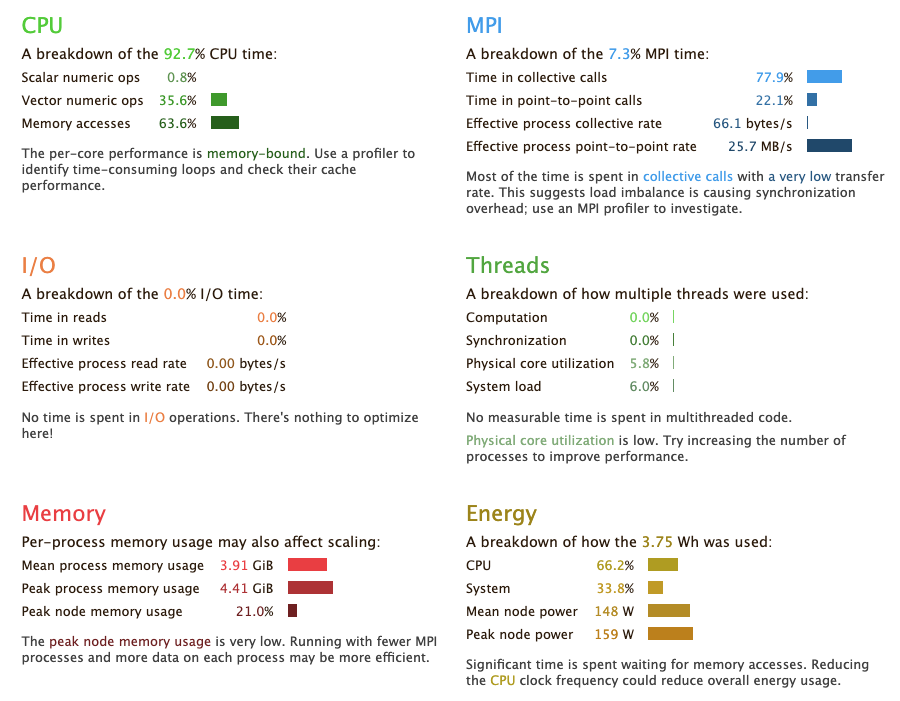
Then, the report shows more detailed info in each category, by breaking down relevant performance metrics into subcategories. For example, The 'CPU' component shows how much time was spent on scalar numeric operations, vector numeric operations and memory access. Similar breakdowns are done for MPI, I/O, threading, etc.
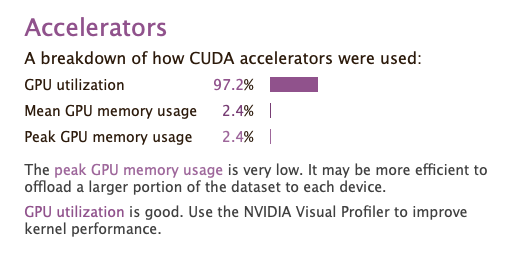
Performance Reports provides a GPU performance summary for a GPU code in the 'Accelerators' section:
Summarizing an existing MAP file
If you have performance data collected with MAP before, you can get a performance summary report from the MAP file, too. To get a report, simply run the perf-report command on the MAP file:
$ ls -l
...
-rw-r--r--   1 elvis elvis   475005 Jun 21 17:16 jacobi_mpi_8p_2n_2019-06-21_17-16.map
...

$ perf-report jacobi_mpi_8p_2n_2019-06-28_08-49.map

$ ls -l
...
-rw-r--r--   1 elvis elvis   476414 Jun 28 08:52 jacobi_mpi_8p_2n_2019-06-21_17-16.html
-rw-r--r--   1 elvis elvis     3078 Jun 28 08:52 jacobi_mpi_8p_2n_2019-06-21_17-16.txt
...