NVIDIA profiling tools
Nsight Systems
NVIDIA® Nsight™ Systems is a system-wide performance analysis tool designed to give an overview of an application’s performance and identify the largest opportunities for optimization. It produces a timeline view for any quantity of CPUs and GPUs.
The basics
Loading cudatoolkit will give you access to both CLI and GUI for Nsight Systems (nsys/nsys-ui) tools, and their versions will be consistent with the release of NVHPC SDK. To run Nsight Systems simply include the following in your run command:
srun <args> nsys profile --stats=true -t nvtx,cuda <code> <args>
Running NSight Tools
When doing analyses with NSight tools, always use $SCRATCH. You may see a variety of errors if you run them on other file systems.
You can change the name of the report created by adding -o report_name to the argument list. To view the output it is easiest to copy the .nsys-rep file to your local machine and view it with the Nsight Systems user interface there. To do this:
nsys-ui report_name.nsys-rep
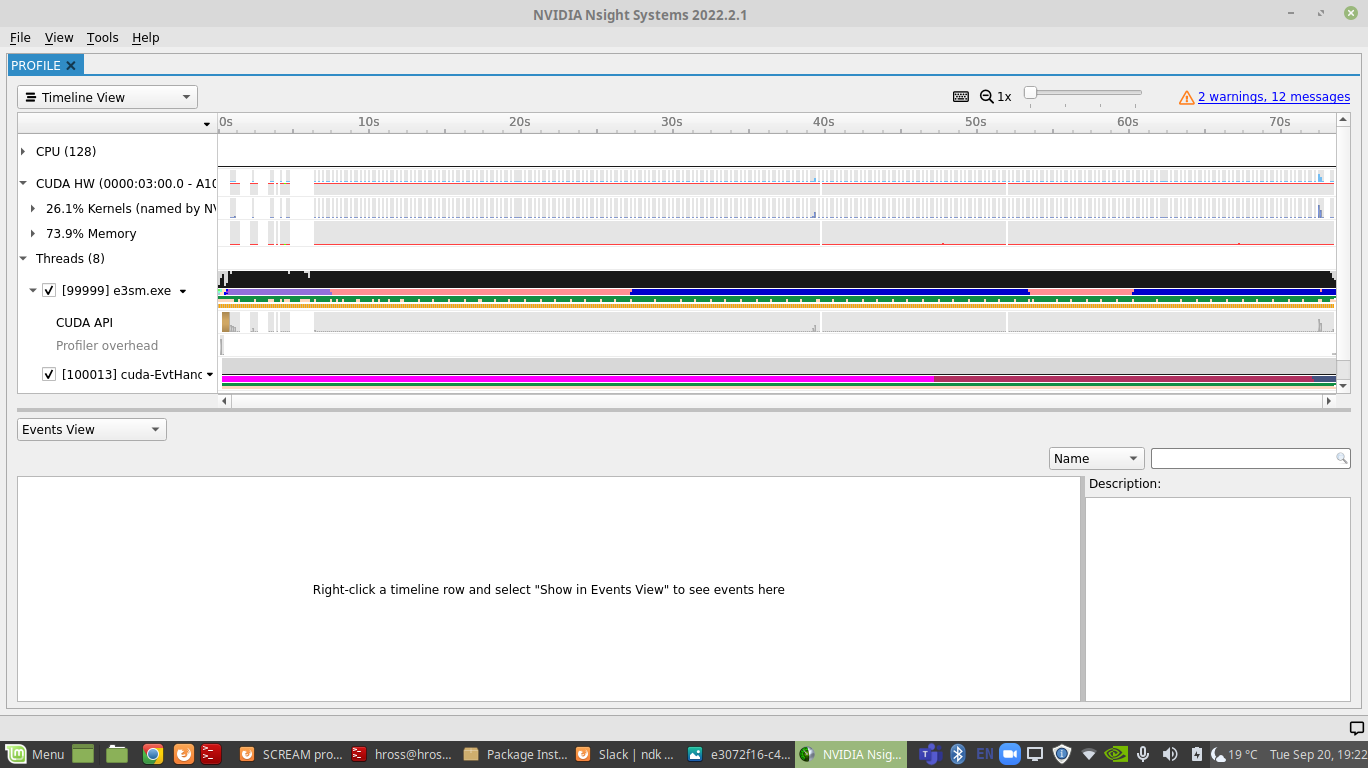
It is very important that the version of Nsight Systems on your local machine is the same as the one you created the profile with. Below is an example of a profile from the climate code SCREAM:
Naming Kernels
Some applications have many levels of nested namespaces, which cause kernel names generated by Nsight Systems to be extremely long and not very useful. For example, here is a kernel name from the climate code SCREAM:
void Kokkos::Impl::cuda_parallel_launch_constant_memory<Kokkos::Impl::ParallelFor<scream::p3::Functions<double,
Kokkos::Device<Kokkos::Cuda, Kokkos::CudaSpace>>::p3_main(const scream::p3::Functions<double, Kokkos::Device<Kokkos::Cuda,
 Kokkos::CudaSpace>>::P3PrognosticState &, const scream::p3::Functions<double, Kokkos::Device<Kokkos::Cuda,
 Kokkos::CudaSpace>>::P3DiagnosticInputs &, const scream::p3::Functions<double, Kokkos::Device<Kokkos::Cuda,
 Kokkos::CudaSpace>>::P3DiagnosticOutputs &, const scream::p3::Functions<double, Kokkos::Device<Kokkos::Cuda,
 Kokkos::CudaSpace>>::P3Infrastructure &, const scream::p3::Functions<double, Kokkos::Device<Kokkos::Cuda,
 Kokkos::CudaSpace>>::P3HistoryOnly &, const scream::p3::Functions<double, Kokkos::Device<Kokkos::Cuda,
 Kokkos::CudaSpace>>::P3LookupTables &, const ekat::WorkspaceManager<ekat::Pack<double, (int)1>, Kokkos::Device<Kokkos::Cuda,
 Kokkos::CudaSpace>> &, int, int)::[lambda(const Kokkos::Impl::CudaTeamMember &) (instance 1)], Kokkos::TeamPolicy<Kokkos::Cuda>,
  Kokkos::Cuda>>()
It is useful to add our own labels to the kernels so we can easily locate them in the code. To do this, simply pass a string as the first argument of a Kokkos kernel (this is already done for most kernels). Next, you need to build the KOKKOS profiling library and set the environment KOKKOS_PROFILE_LIBRARY to use the NVTX connector. Follow these steps:
Set the CUDA_ROOT environment variable and path to the Kokkos nvtx connector:
module load cudatoolkit
export CUDA_ROOT=$CUDA_HOME
export KOKKOS_PROFILE_LIBRARY=/global/homes/e/elvis/kokkos-tools/profiling/kp_nvtx_connector.so
The above steps ensure that the profiling setup is correctly configured to use the NVTX connector.
When running Nsight Systems be sure to use the -t nvtx,cuda option. The image below shows kernels with their given names in the lower row of the NVTX section of the profiler:
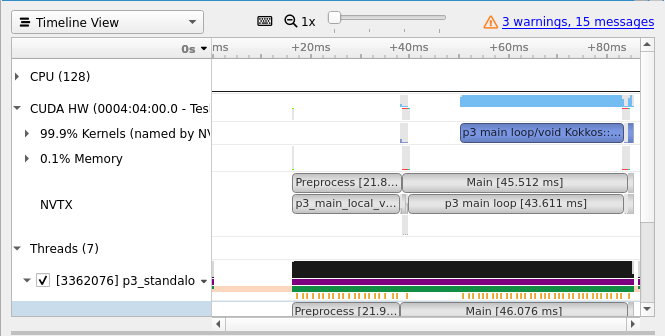
Adding ranges
Stop and start: The start stop functionality allows the user to only run the profiler on a chosen section of the code. In the image above the profiler has been instructed to only profile the section of the code calling P3. To do this in c++:
#include cuda_profiler_api.h

cudaProfilerStart();
... code you want in the profile...
cudaProfilerStop();
and add the option --profile-from-start off to the profiler arguments.
Pop and push: The pop and push functionalities allows a range to be added as an extra row in the profiler. This is very useful if you want to quickly and clearly see where in the code various kernels are being called. Figure 2 shows two ranges (in the upper part of the NVTX row, above the named kernels) that helps distinguish which kernels are in the preprocessing part of the code and which are in the main call. To use this functionality you must include the compiler flag: -lnvToolsExt
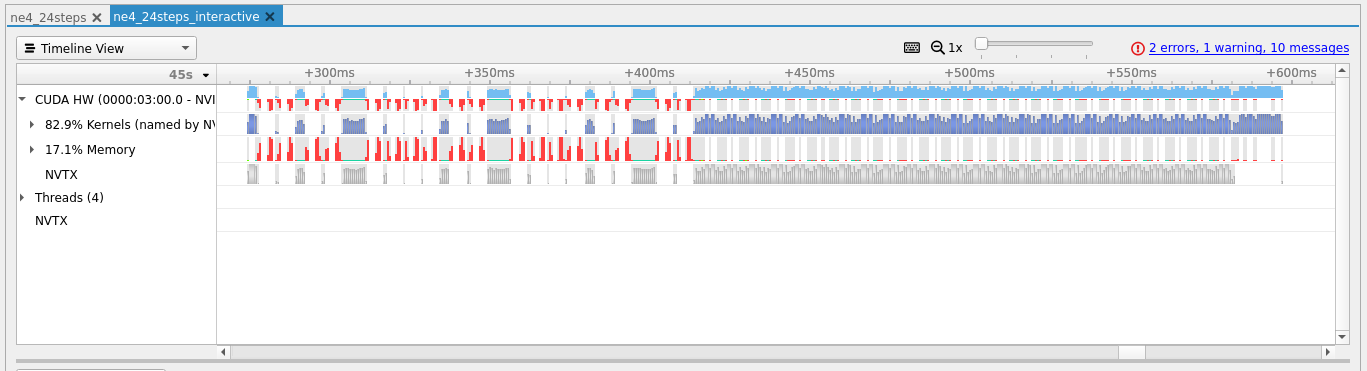
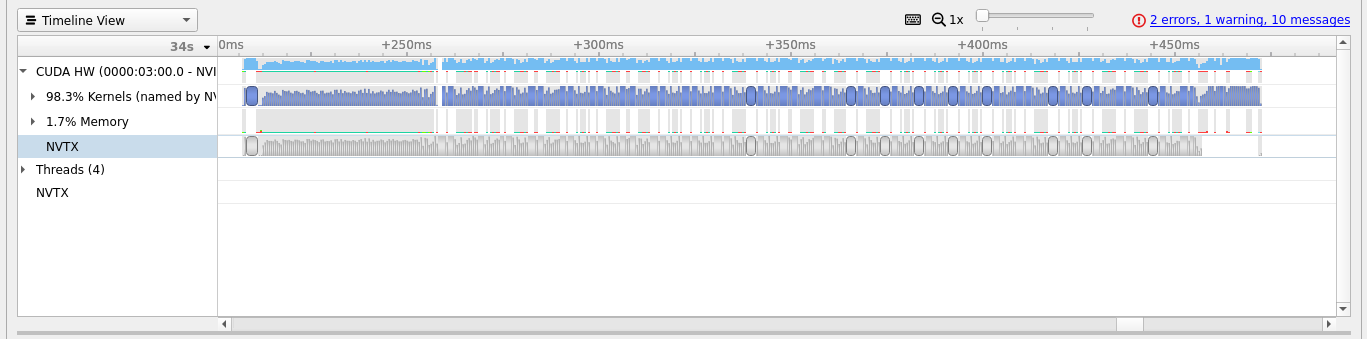
Looking for excessive memory usage
It is important to look out for excessive transfers between the host and device. Below is another example from the climate code SCREAM of a profile with diagnostics and IO on in the upper panel, and off in the lower panel. The memory transfers are red in color, and can be expanded for more details, and we can see that there are significantly more in the top panel. While this may be unavoidable in some situations, in this case it is slowing the code down significantly.
Getting profiles for each MPI process
For larger jobs you might want to profile many ranks at the same time. To do this use the SLURM_PROCID and SLURM_JOBID to give each output file a different name as follows:
srun <args> nsys profile --stats=true -t nvtx,cuda -o report_name.%q{SLURM_PROCID}.%q{SLURM_JOBID} <code> <args>
Nsight Compute
Nsight Systems is good to get an overview of the performance of the whole code. However, sometimes we want to look at a particular kernel in more detail. To do this we use Nsight Compute, which provides detailed performance metrics and API debugging via a user interface and command line tool.
Loading cudatoolkit will give you access to both CLI and GUI for Nsight Compute (ncu/ncu-ui) tools, and their versions will be consistent with the release of NVHPC SDK.
Pausing and resuming NVIDIA DCGM profiling
NVIDIA Data Center GPU Manager (DCGM) is a light weight tool to measure and monitor GPU utilization and comprehensive diagnostics of GPU nodes on a cluster. NERSC will be using this tool to measure application utilization and monitor the status of the machine. Due to current hardware limitations, collecting profiling metrics using performance tools such as Nsight Compute, TAU and HPCToolkit applications that require access to hardware counters will conflict with the DCGM instance running on the system.
To invoke performance collection with ncu one must run dcgmi profile --pause to pause DCGM profiling first, as will be shown in the next section. After running Nsight Compute, one can resume DCGM profiling by running dcgmi profile --resume.
If you do not pause DCGM, then the following error will occur:
==ERROR== An error was reported by the driver

==ERROR== Profiling failed because a driver resource was unavailable.
Ensure that no other tool (like DCGM) is concurrently collecting profiling data.
See https://docs.nvidia.com/nsight-compute/ProfilingGuide/index.html#faq for
more details.
==ERROR== Failed to profile "<kernel_name>..." in process <pid>
The basics
To run Nsight Compute:
srun --ntasks-per-node=1 dcgmi profile --pause
srun <srun args> ncu --kernel-id :::1 -o report_name <other Nsight Compute args> <program> <program args>
srun --ntasks-per-node=1 dcgmi profile --resume
Note that, to invoke performance collection with ncu, we first pause DCGM profiling, and then resume it after ncu profiling, as explained in the previous section. The commands will work for single node or multiple node runs.
Running profiler on multiple nodes
The DCGM instance on each node must be paused before running the profiler. Please note that you should only use 1 task to pause the DCGM instance as shown above.
The ncu command will produce files with the extension .ncu-rep. It is important to include the --kernel-id :::1 argument as this means each kernel is only run once. Without this, profiling quickly becomes very expensive.
It is easier to view these result files on your local machine with Nsight Compute (again make sure that you are using the same version as you ran with on Perlmutter).
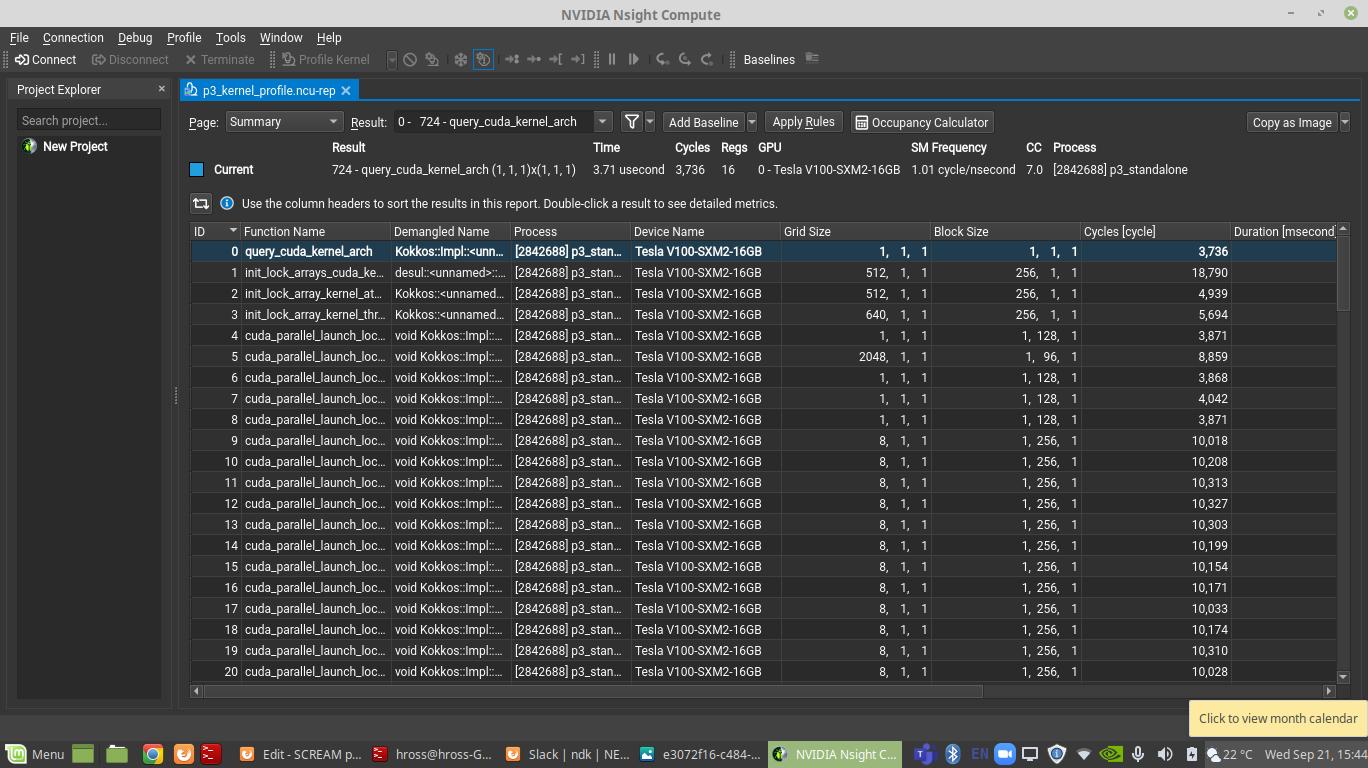
You should see an output similar to that shown below:
Profiling when there is more than 1 MPI rank per Node
Sometimes profiling for one rank may be good enough. If that is the case for your app, you can use a wrapper to only profile a single rank. The following is to profile for MPI rank 0:
#!/bin/bash
if [[ ${SLURM_PROCID} == "0" ]] ; then
        ncu --target-processes all -o report.%q{SLURM_PROCID}.%q{HOSTNAME}.%q{SLURM_JOBID} $*
else
        $*
fi
Then run as follows:
srun <srun args> ./wrapper.sh <other Nsight Compute args> <program> <program args>
Adding ranges
To profile a specific range of the code with Nsight Compute use the nvtxRangePush/Pop functionality described above. When running the profiler include the following arguments:
srun <srun args> ncu --nvtx --nvtx-include <expression>
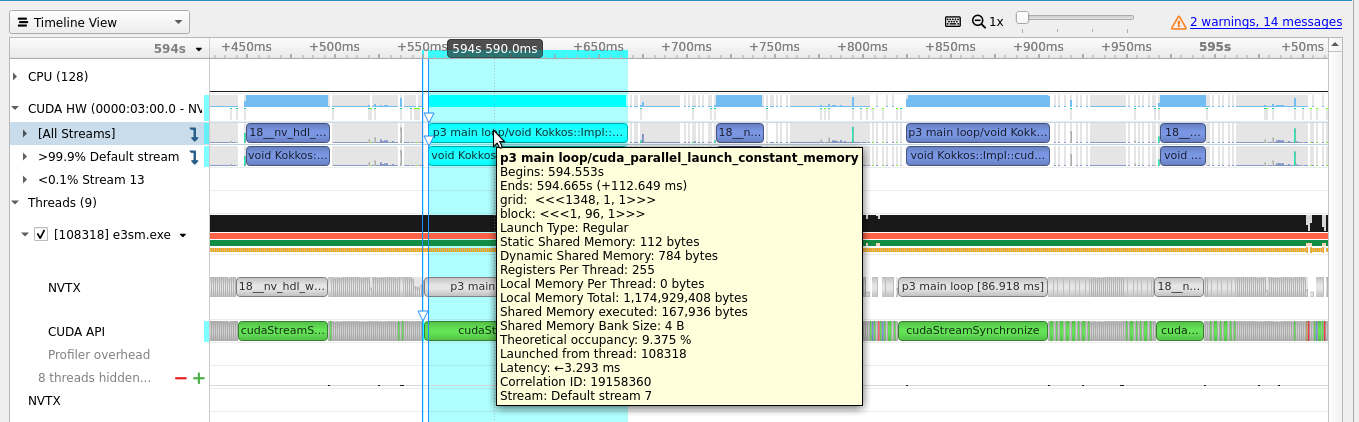
Profiling a specific Kernel from Nsight Systems
Sometimes we want to profile a single kernel we see in Nsight Systems and the kernel name is too long for us to use. A workaround for this situation is to get the kernel launch number. First right click on the kernel you want to profile:
Select “Analyze the Selected Kernel with Nvidia Nsight Compute” and you will get this popup:
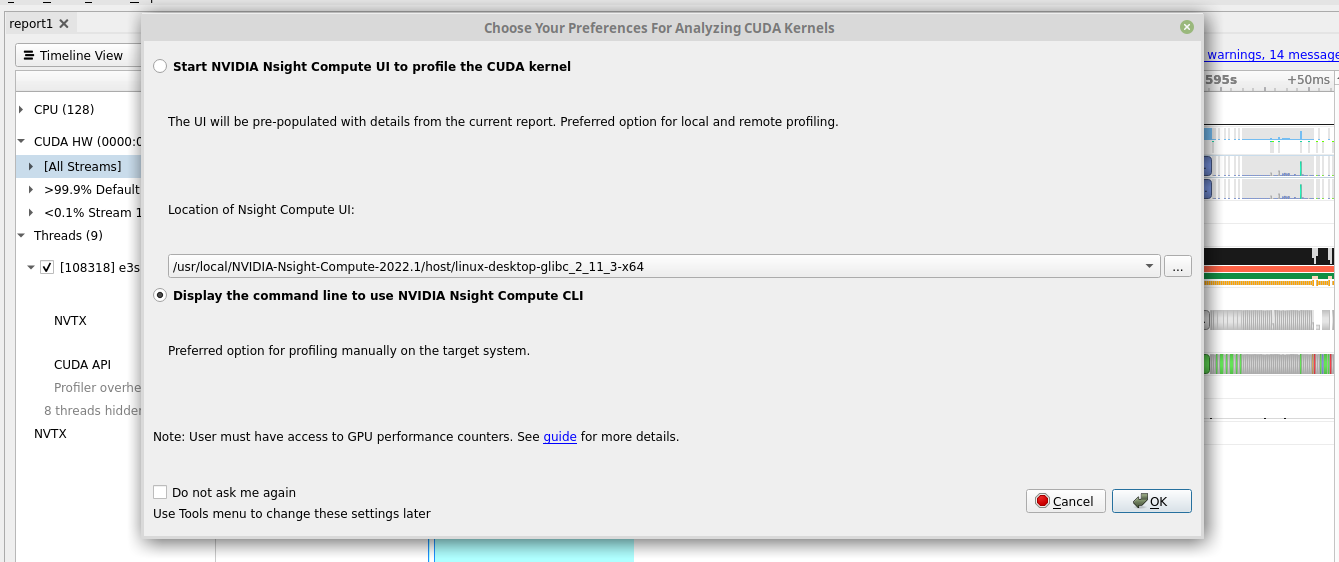
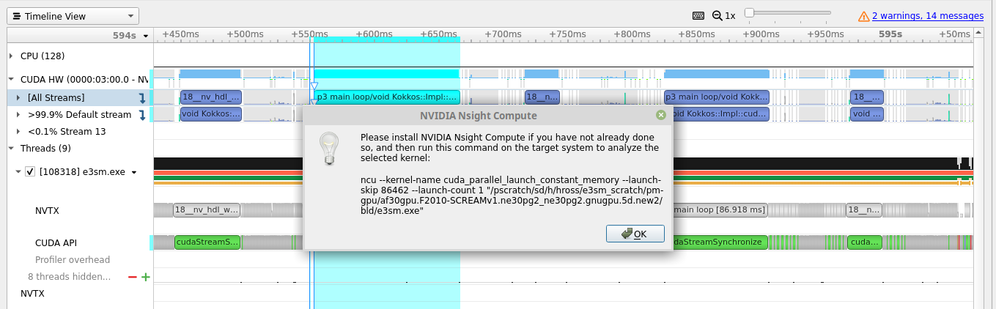
Select “Display the command line to use Nvidia Nsight Compute CLI” and it will give you the appropriate command to use to target the selected Kernel using the --launch-skip parameter.
Roofline plots
A common performance metric is a roofline plot. To produce roofline plots be sure to include the option -set full as one of the arguments for Nsight Compute. To see the roofline plot, select the kernel you want to analyze and then go to Details (under page). You should see something similar to the image below:
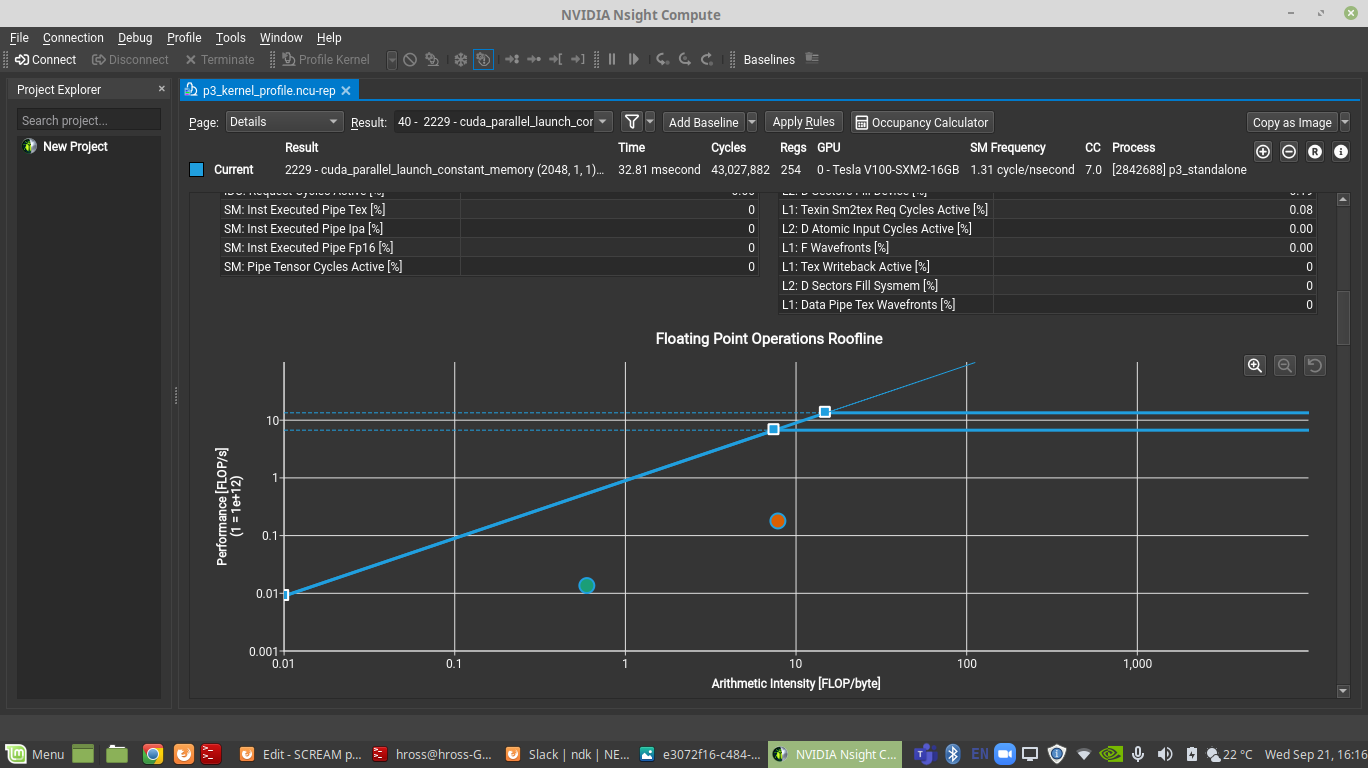
Note that here are two points, one for single precision, and one for double precision.
Resources
For more information please see the Nvidia documentation.
You may also find this presentaion on Nsight Compute useful.