Iris Guide for Users
Getting Started
The Iris system is a web portal that allows users to manage their NERSC account: reset their passwords, edit their account details and add MFA (Multi-Factor Authentication) tokens.
Iris also allows users to track their resource usage at NERSC. It allows viewing past jobs and storage usage and getting information about their projects.
Finally, Iris has a reporting capability to get detailed information about their activity at NERSC.
First Time Login
The first time you log in to Iris, you will have to change your NERSC password. Your NERSC password is also your Iris password and all NERSC passwords must abide by certain requirements.
Logging In
To log in to the Iris system, point your web browser to the URL https://iris.nersc.gov. Please use this URL as a bookmark for Iris.
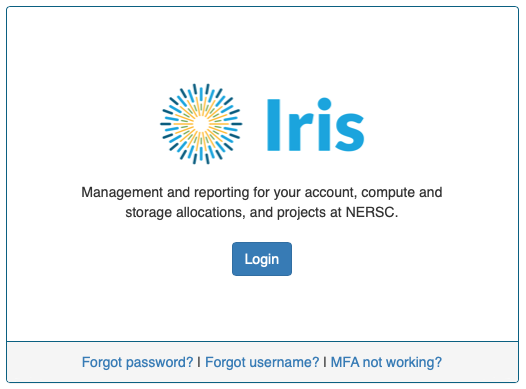
Click the Login button, and you will be redirected to the NERSC login selector webpage. Log in either with your home institution credentials (if enabled) or enter your NERSC username, password, and MFA one-time password (OTP).
Reset NERSC password
If you forgot your password, follow the instructions in the 'Forgotten Passwords' section of the Password webpage to reset your password.
Forgot your username?
If you forgot your username, click the 'Forgot username?' link. Enter your email address and a MFA OTP to receive your username by email. NERSC will email you instructions for retrieving the username.
Reset MFA tokens
If you have to reset all your MFA tokens because, for example, you lost the device where MFA tokens were configured, please follow the instructions in the 'If You Lost Your Tokens' section of the MFA webpage.
Problems accessing Iris?
If you still have a problem with your username or password, contact the NERSC Account Support Office by sending email to accounts@nersc.gov.
If you can't log in due to a different reason, get help from a NERSC consultant by opening a trouble ticket from NERSC Help Portal (https://help.nersc.gov).
Obtaining a User Account
If you don't have an active user account, please follow the instructions in the Accounts page.
Navigating Around Iris
Navigational Items at the Top
There are a few navigational items at the top of the webpage.

-
Your account name is displayed in the top right corner and is clickable. It brings you to your account's Profile page.
-
The search box allows you to quickly get information that you want about an individual user or a project.
-
The "hamburger" icon (the one with three horizontal lines) contains a list of submenus. When clicked, they are revealed in the left sidebar. To remove the sidebar, click 'X'.
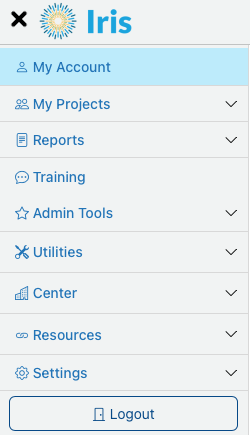
A couple of UI (user interface) configuration options are provided for flexible handling of the contents with the hamburger submenus by various devices. Please see the UI settings section.
-
The Iris icon next to it is clickable and serves as the Home button. This brings you back to the "Homepage" which is your account's Profile page.
-
To logout, click on the hamburger icon, and then the Logout button.
For certain menu items, there is also a sub menu bar under the top menu bar with several menu tabs. When this bar appears, the first value on the left is to give you the context for the page displayed. For example, if the page content is about your account itself (that is, when the Iris icon is selected), the label will be your full name, as shown above. If the content is about a project account, it will display the project's name.
These menu bars are fixed in the page and do not scroll away even when you scroll down the page.
Sorting the Display Data
Displayed data can be sorted by a column by clicking on the column label in the table. By default data is sorted in the ascending order. Clicking on the label again, you can toggle the sorting order.
A gray line appears beneath or above the column label to indicate the table column that the displayed data is sorted by and the sorting order.
My Account
When you log in to Iris, you will see by default information about your own NERSC account, such as contact information, your allotment and usage of computational resources, NERSC MFA (Multi-Factor Authentication) setting, etc.
Iris provides several tabs for different aspects of the account: CPU, GPU, Jobs, Storage, Roles, Groups, MFA, Profile, and History. See a figure above.
CPU
This menu lists all the compute allocation accounts on the machines with CPU architectures (in contrast to GPUs) that you have access to, and shows YTD (year-to-date) usage for each. This page shows the following, for each allocation account:

-
Project: All the compute allocation projects that you belong to. If you click on a project, it will show details about the allocation account itself. A project can have both a CPU allocation account (see the second column) and a GPU allocation account (see the second column under the GPU tab).
-
Account: All the CPU allocation accounts that your allocation projects access to. The name of an CPU allocation account is the same as the project name (the first column).
-
Default: The default allocation account to charge your usage on CPU architectures to when the charging account is not explicitly specified during batch job submission. If you want to change the default account, just click the box in the corresponding row.
-
Node Hours Charged: Charged CPU Node Hours; compute usage times are charged according to the scheme explained in the Queues and Charges page.
Click on the charge value, and the page will display detailed info about your daily usage for the allocation account.
-
Machine Hours: Node hours after factoring in the architecture charge factor.
-
Node Hours: Raw node hours used.
-
Avg CF: Average QOS cost factor ratio. If all of your batch jobs ran with the 'regular' QOS with no discount, the ratio will be 1.0.
-
Remaining: Remaining balance in CPU Node Hours.
-
% Remaining: Remaining balance as the percentage of the project allocation.
-
Allocated Hours: Quota for the CPU allocation hours that your project's PI, PI proxy or PI Resource Manager allocates for your usage. They allocate an amount using either the absolute CPU Node Hours or a percentage.
-
Computed Allocation: The Allocated Hours value which can be set in terms of either node hours or a percentage (see the previous tab) is provided in both the node hours and the percentage. So if your PI gives you an allocation in terms of, for example, a percentage of his/her allocation, you now know how many node hours that amounts to.
-
Last Updated: Time stamp for the last usage update in Iris.
There is a section 'QOS' at the bottom, listing special QOS' that your account is permitted to access to, in order to use special resources (e.g., the premium QOS) by PI's permission or under a special arrangement. If you don't have any special QOS, then the table is empty.

GPU
This menu lists all the GPU allocation accounts associated with user's project accounts. Computation usage on GPU nodes is charged to a GPU allocation account.

See the CPU section above to see the meaning of the column names in the table. Please note the following.
- The name of a GPU allocation account is its project name appended by
_g. - The default GPU account to be charged to is not set and users need explicitly specify the GPU account name with Slurm's
-Aflag when a batch job is submitted. - There is no separate 'QOS' section under the GPU tab. The allowed QOS' set in the 'QOS' section of the CPU tab apply to both CPU and GPU batch jobs.
Jobs
This page lists jobs that you ran on NERSC machines, along with a time-series plot for the jobs on the top and individual jobs at the bottom.
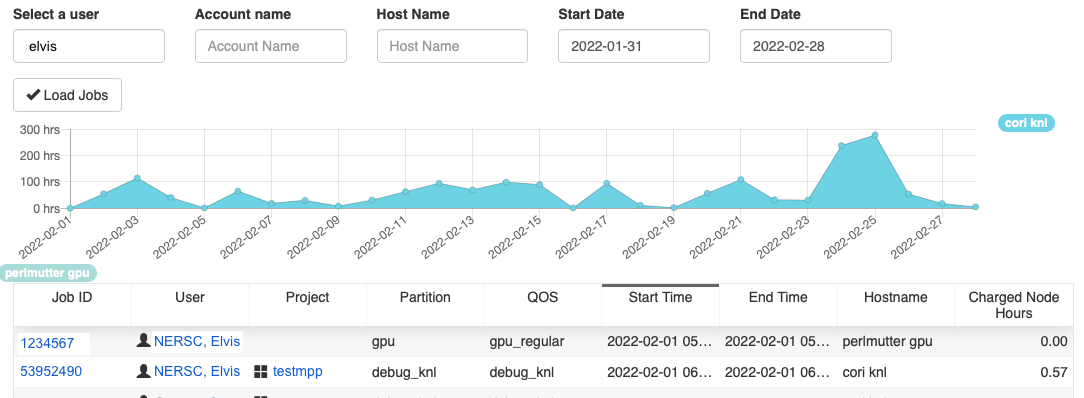
By default, the page lists the jobs you ran during the last one month. To view job data with different start and end dates or for a specific host (e.g., perlmutter cpu, perlmutter gpu, ...), etc., enter the appropriate values for your search, and click the 'Load Jobs' button.
Clicking on a job ID link from the displayed result, you will see a summary about the job such as host; job name; allocation account; charge info; submit, start and end times; the compute nodes used, etc.
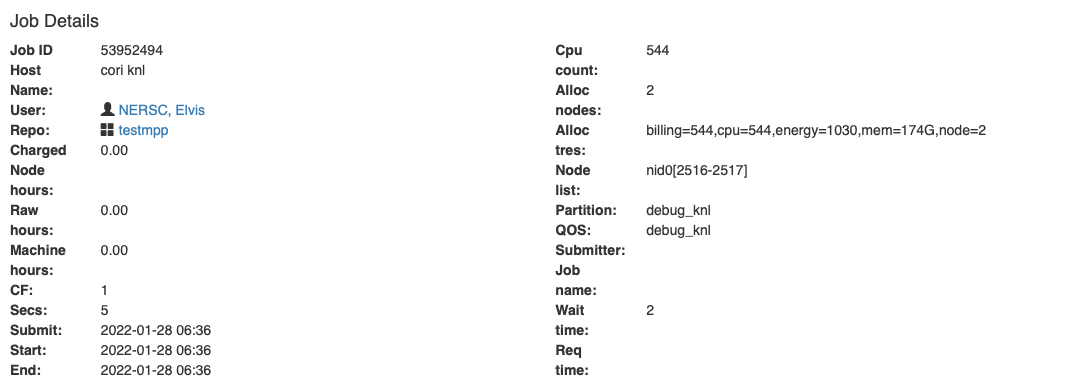
Below there is a section titled 'Job Transfers'. This area provides a record of all deposits and withdrawals made to/from your project's allocation accounts.
Below it, there is another section titled 'DataCollect Info'. When the 'More Info' button is clicked, it shows details for individual job steps (that is, individual srun instances), such as the working directory, arguments, srun parameters, etc.
At the bottom of the page, there is the 'Display Job Metrics' section, still in an experimental stage, which, when fully implemented, will display plots of some performance data (e.g, instructions per cycle (ipc_by_step and ipc_by_step_and_node) and memory usage) and power usage of the job. Select a metric and then click the 'View graph' button.
Storage
This area is about your usage of scratch file system, the HPSS archive system and the global home file system.
-
Storage Type User Quotas: Space and inode quotas ('Storage (TB)' and 'Inodes (M)', respectively) of the Perlmutter scratch file system are shown. If a quota increase request was approved, it also shows when the increased quota will expire ('Expires At').
-
HPSS Archive: Space quota and usage data ('User Quota' or '% Allowed by Project', and 'Storage Used', respectively) for the HPSS archive system.

This area shows usage and account settings per user for the project's HPSS allocation. PIs and project managers can assign user quotas.
The HPSS storage system tracks usage for each user, but it does not know which allocation account the user belongs to. HPSS user usage information is transmitted to Iris once a day. Iris distributes the user's usage into their storage allocations using their '% of Your Data to Charge to Each Project' values. To change the values, type in the percent to assign to each project and click the 'Update HPSS Allocations' button above the table. Iris initially assigns your project percents based on the relative sizes of your storage allocations. It is user's responsibility to set appropriate percentage values in the user account, if they use multiple allocation accounts. For more info on HPSS charging, please see HPSS archive system.
-
HPSS Tokens: You can manually generate HPSS tokens which can be used for accessing the HPSS archive system on your local machine, from an external IP address or within NERSC.

To generate a token, click the 'Generate' button and follow the instruction. For more info, check the Manual Token Generation section.
-
Home Directory Usage: Space and inode usage data ('Storage Used' and 'Files Used', respectively) for the global home file system.

Roles
This page shows user's roles in three different context: Iris Role, Project Role and DOE Administrative Role. To see detailed info on the Roles and their permissions, go to the Iris Roles section.
-
Iris Role: Various Iris administrative roles mainly for NERSC staff in Iris web portal. The role that most NERSC users will find themselves in is No Role.
-
Project Roles: A role of a user in a project is PI (Principal Investigator), PI proxy, Project Resource Manager, Project Membership Manager, or User. When a user has a high enough project role, the user is able to edit other member's roles in the project. For example, if you are the PI of your project, you can edit compute allocation for your members in Iris. To see what project managers can do, you can go to the Iris Guide for PIs and Project Managers.
-
DOE Administrative Roles: This role is relevant to only DOE managers and NERSC allocation staff members, for managing allocations.
Groups
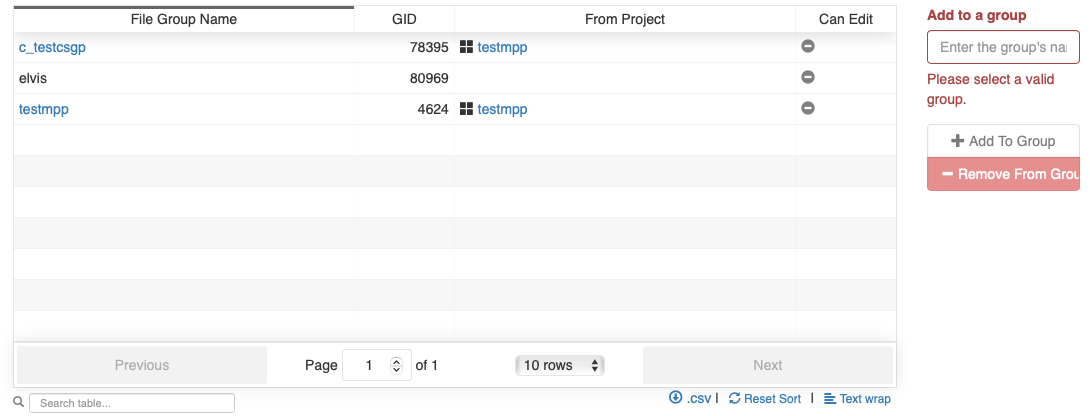
The display shows which Unix file groups you are a member of. You will see file group names, their GIDs (numeric group identifiers), and the associated allocation project accounts.
MFA
The page lists your MFA (Multi-Factor Authentication) tokens. For more info on this topic, please see the MFA webpage.
You can create, delete, and test each token. To add a new one, click the '+ Add Token' button on the right. You can have up to four tokens. To delete one, click the 'Delete' button.

You can request NERSC to clear login failures accumulated on the NERSC OTP (one-time password) server as a result of entering the wrong OTP too many times. These failures could prevent you from logging in. However, they are automatically cleared after 15 minutes. Note that the login failures mentioned here are different from the login failures that would lock you out of a NERSC host indefinitely for entering the incorrect password too many times. This kind of failures can be cleared from the 'Profile' menu below.
To generate backup one-time passwords, click the 'Backup Passwords' button.
The 'Delete All Tokens' button is reserved only for NERSC administrators. So is the 'Clear All Failures' button.
Profile
This page is broken into several sections related to user profile and access modes for NERSC resources. The first two sections are about your contact info. In order to communicate effectively with users and in order to abide by DOE computer use regulations we must have the following information for each user: name, email address, work phone number, and work institution (organization), etc. Please keep your personal information current. This is important so that we can contact you.
-
User Organization: Information about your work institution. Note that you cannot edit this section directly -- this is generated automatically from the info you provided in the next section.
-
ORCID Id: All users are required to have a valid ORCID (Open Researcher and Contributor ID).
-
Self-service User Info: User contact information. If your information changes, please correct the info and then click the Update button at the right.
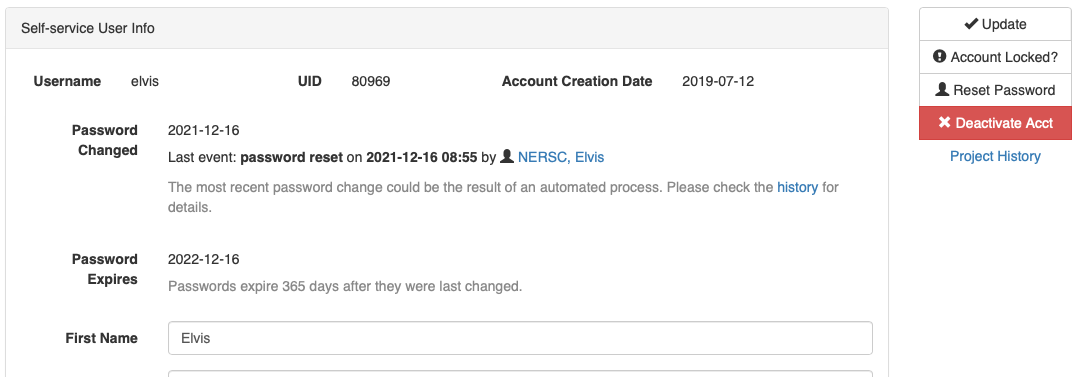
You can enter in the Preferred Name field the name you go by that may or may not differ from your legal name. If you enter a preferred name here, we'll use it in most of our communications with you. You need to enter your legal name in the Legal Name field.
You can optionally provide your pronouns in the Pronouns field.
If you are locked out of a host after entering incorrect password too many times, click the 'Account Locked?' button.
You can reset your NERSC password by clicking the 'Reset Password' button. For instructions, please see the How To Change Your Password in Iris section.
If you want to view your Iris project data of a previous allocation year, click the 'Project History' link at the right, and select the allocation year.
If you cannot find your organization from the provided institution list, you can click the 'I can't find my organization' link in this section and provide the requested info about your institution.
Changes in the Citizenship or Organization fields could trigger a re-vetting of your account depending on the changes that were made. Your account access will be disabled during the process, which is normally quick but in some cases can take up to a week to complete.
-
Registered External Identities: This is to link your home institution's identity to your NERSC account for Federated identity so that you can use it to authenticate to NERSC web resources. For detailed instructions, please see the Connecting Your Identity with NERSC section.
-
Server Logins: The NERSC hosts that you have access to (e.g.,
perlmutter,hpss,datatran, etc.) are listed. The login shell and other login account information for each host are displayed.You can change the login shell for a host by clicking on the 'Edit' button under the 'Actions' column for the corresponding host.
-
Gridcerts: You can register your grid certificate here. To add a new grid cert, click the '+ New Cert' button.
-
User Settings: This section is reserved only for NERSC staff for administrative work in handling user ticket requests.
-
Publications: To enter your publication records, click the '+ Add Publication' button and enter the publication's DOI number.
-
Superfacility API Clients: To create a new Superfacility API client, click the '+New Client' button. For instructions, please see the Create a Superfacility API Client in Iris section.
NERSC requires all users to verify their contact information on an annual basis. When you get an email on this from NERSC, please complete it by the due date. Otherwise, your account will be temporarily deactivated. The process will also ask you to read and agree on the Acceptable Use Policy (AUP) and the Code of Conduct.
History
This page records user event history regarding account and allocation support, such as password reset, generation of a MFA token, assignment to a project account, etc. It shows when such events were created and by whom. To see the record of a specific event, click the 'View Log' button in the corresponding row.
My Projects
While the previous menu focuses on resource usage by you, this menu is about resource usage for an allocation project as a whole. To select a project for which you want to check the resource usage, first click 'My Projects' in the hamburger menu. It shows all the allocation projects that you have access to. Select a project that you are interested in. Iris will display similar horizontal tab menus as above.
CPU 
The display shows YTD (year-to-date) usage of the CPU allocation account (in contrast to the GPU account below) of the selected project, with a quick summary about the allocation account, followed by a usage graph over time and then a table for usage per member of the project.
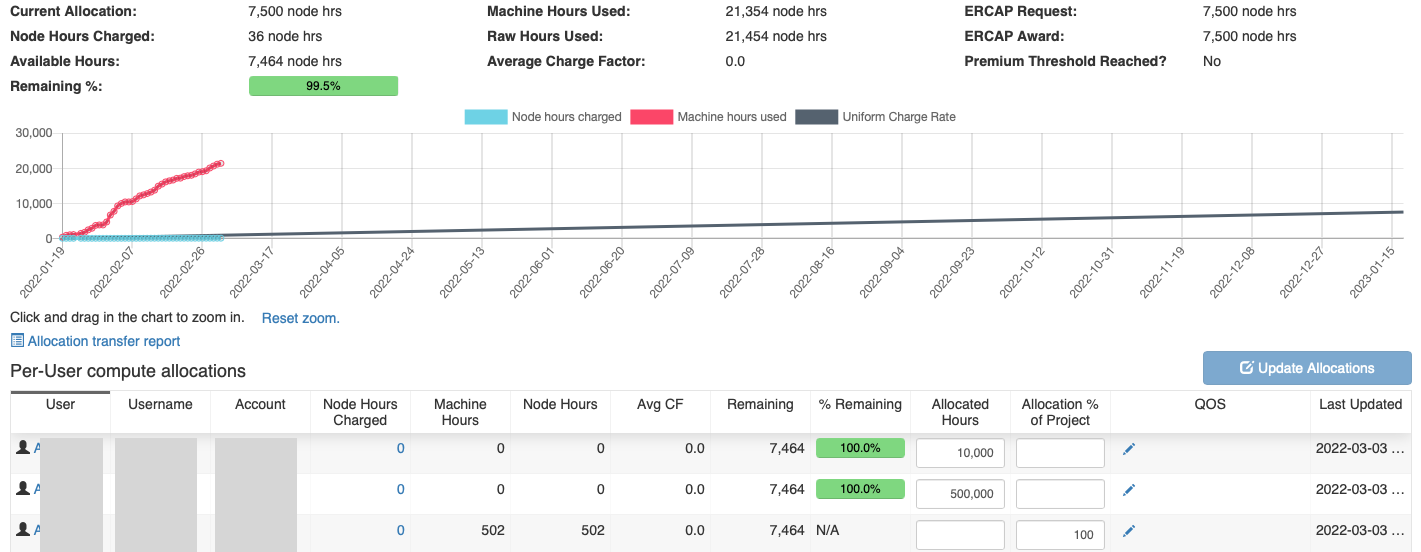
The summary lists the CPU Node Hours charged, raw node hours used, the average QOS factor ratio, the initial allocation award, the balance, etc. Please see the Queues and Charges page to see how the usage charge is computed.
-
Current Allocation: The total allocation in CPU Node Hours.
-
Node Hours Charged: The CPU Node Hours used so far.
-
Available Hours: The remaining balance.
-
Remaining %: The remaining balance as a percentage.
-
Machine Hours Used: The aggregate sum of node hours after factoring in respective machine charge factors.
-
Raw Hours Used: The aggregate sum of node hours used over all NERSC computational systems.
-
Average Charge Factor: Average QOS factor ratio. If all the batch jobs ran with the 'regular' QOS with no discount, the ratio will be 1.0.
-
ERCAP Request: The allocation amount requested by the PI in the allocation request (ERCAP).
-
ERCAP Award: The allocation amount awarded for the ERCAP by the allocation managers. The 'Current Allocation' value can differ from this if an additional amount was successfully granted after exhaustion of the initial allocation.
-
Premium Threshold Reached?: This indicates whether usage of the premium QOS by the project is over the threshold value, which will cause the premium charge factor to be doubled. For info, see QOS Limits and Charges section.
-
Premium Hours Used?: This show the total node hours used with the premium QOS and the percentage of the allocation.
The usage graph includes charged CPU Node Hours and machine node hours over time. The plot for the charged CPU Node Hour trend can be compared with the uniform charge rate plot as a reference, to give you a sense whether your allocation is being drained too fast or slow. You can zoom in on a rectangular region by using mouse click and drag. To go back to the full graph, clink on 'Reset zoom'.
The usage table in the Per-User compute allocations panel includes the following columns:
-
User: All the members belonging to the project. If you click on a user, it will show info about the user.
-
Username: NERSC account name.
-
Account: CPU allocation account associated with this project account.
-
Node Hours Charged: Charged CPU Node Hours; compute usage is charged according to the scheme explained in the Queue Policy page.
Click on the charge value, and the page will display detailed info about your daily usage logs for the allocation account since the beginning of the allocation year.
-
Machine Hours: Raw node hours used.
-
Node Hours: Raw node hours used.
-
Avg CF: Average QOS cost factor ratio. If all of the batch jobs ran with the 'regular' QOS with no discount, the ratio will be 1.0.
-
Remaining: Remaining balance in CPU Node Hours.
-
% Remaining: Remaining balance as the percentage of the CPU Node Hour quota.
-
'Allocated Hours' or 'Allocation % of Project': Quota for the CPU allocation hours that your project's PI, PI proxy or PI Resource Manager allocates for users. They allocate an amount using either the absolute CPU Node Hours or a percentage of the project's total allocation.
-
Computed Allocation: The Allocated Hours value which can be set in terms of either node hours or a percentage (see the previous tab) is provided in both the node hours and the percentage.
-
'QOS': Special QOS' (e.g., premium) users are allowed to use for the project.
-
'Last Updated': Time stamp for the last usage update in Iris.
At the bottom, you will see the Project/QOS associations panel. This is to create a mapping between this project and a QOS so that every member of the project (including future members) will have the QOS. For example, if the premium QOS is shown here, all project members are entitled to use the QOS for their batch jobs. If there is no such a project-wide QOS, this table is empty. A mapping in this table applies to both CPU and GPU accounts.
GPU 
This menu lists the GPU allocation account associated with the project account. Computation usage on GPU nodes is charged to a GPU allocation account. See the CPU section above to see the meaning of the accounting-related terms. Please note the following.
- The name of the GPU allocation account is the project name appended by
_g. - There is no separate 'Project/QOS associations' section under the GPU tab. The project-wide QOS' set in the CPU tab apply to both CPU and GPU batch jobs.
Jobs 
This page lists jobs run by all the project members, displaying a time-series plot for the jobs completed, followed by the list of individual jobs.
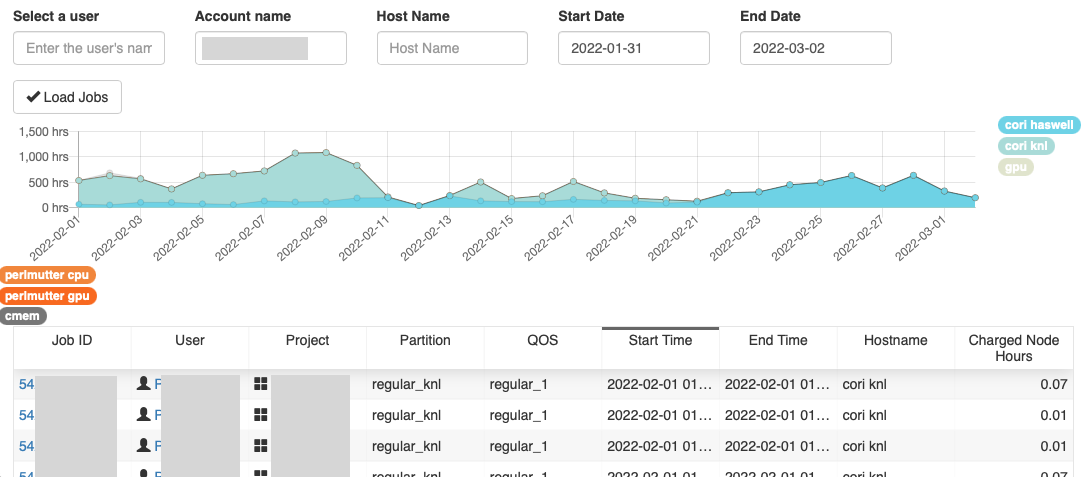
By default, the page lists the jobs run for the last 1 month. To view job data with different start and end dates or for a specific host (e.g., perlmutter cpu, perlmutter gpu, ...), etc., enter the appropriate values for your search in the boxes at the top, and click the 'Load Jobs' button.
Clicking on a job ID link from the displayed result, you will see a summary about the job such as host; job name; allocation account; charge info; submit, start and end times; the compute nodes used, etc.

Scrolling down the page, you can find a section titled 'Job Transfers'. This area provides a record of all deposits and withdrawals made to/from your project's allocation accounts.
Below it, there is a panel titled 'DataCollect Info'. When the 'More Info' button is clicked, it shows details for individual job steps (that is, individual srun instances), such as the working directory, arguments, srun parameters, etc.
At the bottom of the page, there is the 'Display Job Metrics' section, still in an experimental stage, which, when fully implemented, will display plots of some performance data (e.g, instructions per cycle (ipc_by_step and ipc_by_step_and_node) and memory usage) and power usage of the job. Select a metric and then click the 'View graph' button.
Storage 
This area is about the project team's usage of the Community File System (CFS) and the HPSS archive system.
A summary of the CFS storage allocation and usage for the project is provided at the top of the page, followed by a plot of CFS storage usage by the team over time.

Below are the meaning of the terms used:
- Storage Allocation: CFS storage allocation (or quota) for the project.
- Storage Allocated to Directories: If the project has multiple CFS directories for the project, the project team can distribute the allocation among the directories. This is the sum of the maximum storage usage for the directories, and cannot be great than the storage allocation.
- Unallocated Storage: The storage that is not allocated to any CFS directory of the project.
- Storage Used and % Storage Allocation Used: CFS storage usage.
- Files Allocation: CFS inode allocation (or quota) for the project.
- Files Allocated to Directories: The sum of the maximum inode set for the CFS directories of the project; cannot be great than the CFS inode allocation.
- Unallocated Files: The inode allocation not allocated to any CFS directory of the project
- Files Used and % File Allocation Used: CFS inode usage.
You can find the CFS Directory Usage section, too. It shows space and inode usage for the Community File System per individual project members

At the bottom of the page, you can find the HPSS Archive section, which shows the HPSS allocation and usage for the project.

This area shows usage per user of the project's HPSS allocation. PIs, PI proxies and project resource managers can assign user quotas in the '% Allowed by Project' field. For more info, please read the Iris Guide for PIs and Project Managers page.
Roles 
This page displays project roles for all members in a project. The possible project roles are: PI (Principal Investigator), PI proxy, Project Resource Manager, Project Membership Manager, or User.

PIs and PI proxies can change the project role for users. Also, they can add or remove users to/from his/her project account. For more info, please read the Iris Guide for PIs and Project Managers page.
Groups 
The display shows what Unix groups are associated with a project allocation account and who are members of each group.
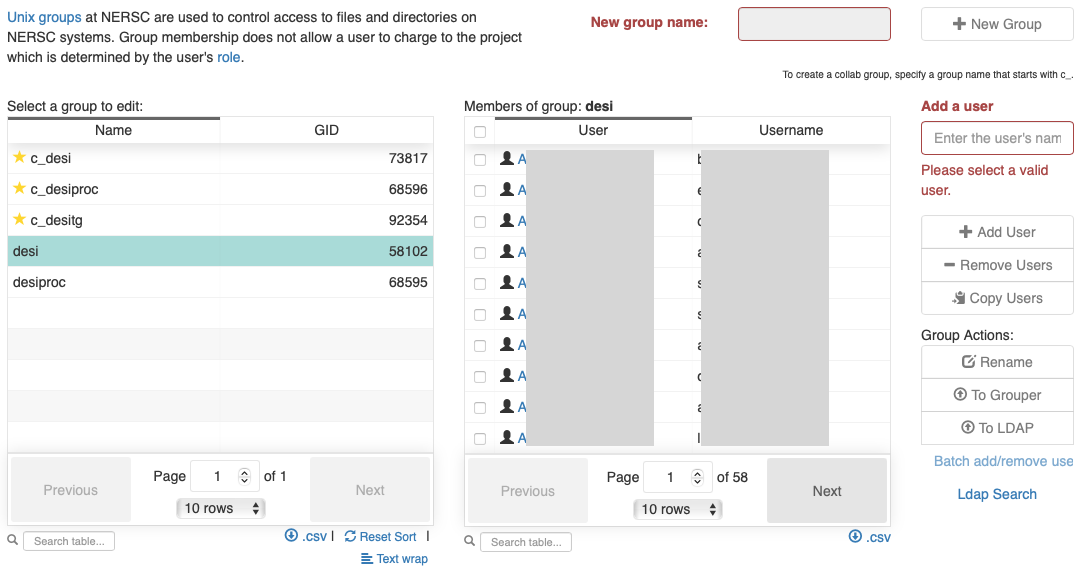
PIs, PI proxies, project resource managers, and project membership managers can request to create a new Unix group by clicking the '+ New Group' button. PIs, PI proxies and project membership managers can add a user to a specific group or remove a user. For more info, please read the Iris Guide for PIs and Project Managers page.
Details
This page shows detailed info about a project itself, such as its PI, PI proxies, project description, allocation pool, allocation type, DOE Office Science Category, ERCAP info, etc.
The 'Total CFS storage available to this project' section summarizes the total CFS storage quotas for the project: space quota in TB, inode quota in millions and the maximum number of CFS project directories that can be created.
Project managers can also add publications to the 'Publications' section by clicking the '+ Add Publication' button.
History 
This tab menu shows all the updates made to the project (such as adding a user to the project) with info on who created the event and when. To see the record of a specific event, click the 'View Log' button in the corresponding row.
Reports
When you click on the 'Reports' menu in the hamburger menu, you will see various report generation options, with which you can view compute and storage usage information for allocation accounts. For example, you can generate compute usage for a certain date or a month, for an allocation account or a group of accounts.
Search and Display Options
Most report types in the Reports menu will show four tabs near the top of the page. They are labeled as 'Select Columns', 'Filter Report', 'Select Rollups', and 'Report Results'. We will discuss about these menus here.
Select Columns
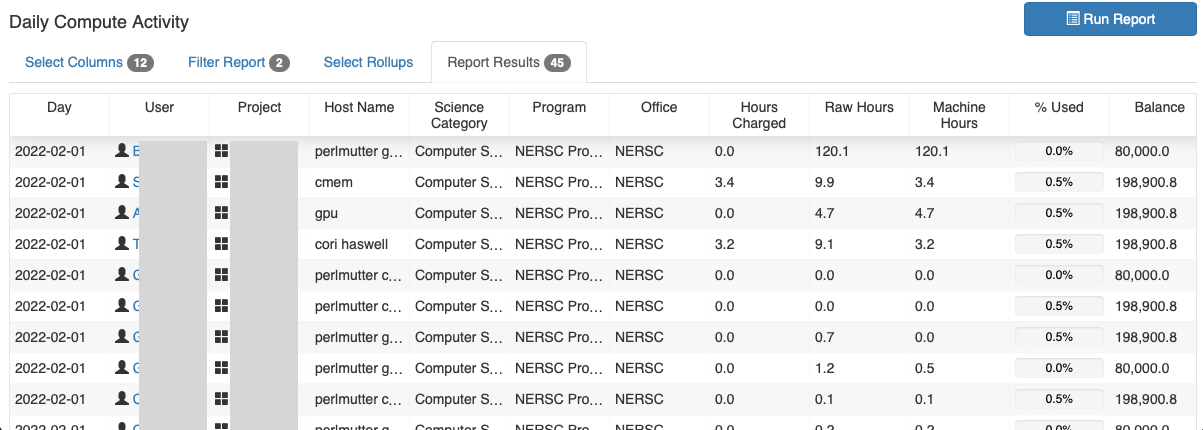
This is to select columns that will appear in a search result. The default set of columns is pre-set depending on the report type. The 'Daily Compute Activity' report includes 'Day', 'User', 'Project', 'Host Name', 'Science Category', 'Program', 'Office', 'Node Hours Charged', 'Raw Hours', 'Machine Hours', '% Used', and 'Balance' while the 'Monthly Compute Activity' report includes the 'Month' column instead of the 'Day' column.

There are other columns available (e.g., 'Premium Hours'), and you can add more by clicking the '+ Add Column' button. To include all available columns, click '+ Add All Columns'.
You can remove a column by clicking on the trash can icon. The order of the columns can be changed with the up and down arrows. If you click the triangle with an exclamation mark inside, all the columns after the column are removed en masse.
The number in the tab is the number of selected columns.
By selecting an optional aggregation operation, a column can be set to show an aggregated value over the data of the same set of attributes (column values), instead of individual data entries. The result of the aggregation will be shown in the column. The supported aggregations are count (frequency of the case with the same set of attributes), count distinct (frequency for the distinct set of attributes), sum (sum of the values over the entries with the same set of attributes), avg, min and max. The header of the column will change to reflect the aggregation operation: 'count of ...', 'sum of ...', etc.
You can mark the 'Single total line (needs aggregations + no rollups)' checkbox to generate a single summary line at the end of the report dataset. It will show the aggregated value over the entire data for the columns containing numeric values with an aggregation operation turned on. Thus, you need to have at least a column with aggregation enabled in order to use this feature. Also, a rollup (see below) should not be set. Columns containing numeric values but without an aggregation enabled will show meaningless numbers: zeros (0.0 and 0.0%).

Filter Report
You can set search criteria that need to be satisfied for a report by using various search categories. Available filter categories are pre-set, depending on the report type. For a 'Daily Compute Activity' report, you can use filters such as 'Day', 'User', 'Project', 'PI', 'Hours Charged', etc. while a 'Monthly Compute Activity' report uses 'Month' instead 'Day'.

To add more filters to narrow down your search, click the '+ Add Filter' button. Select the field name from the pull-down menu. Choose a comparison operator (=, !=, <=, >=, <, >, contains, starts with, is null, or is not null), and enter the field value, if required.
The number in the tab is the number of the filters set.
To generate a report about a previous allocation year, choose the year in the 'Year' pull-down menu. It is set by default to the current allocation year.
Select Rollups
Rollups are an advanced feature that allows for the creation of, for example, subtotal rows of aggregated data. To create a rollup, first there should be at least one aggregated column and at least one non-aggregated column. An aggregation is performed over a non-aggregated column that is set for a rollup, and the end result is generation of a partially aggregated result (e.g., a subtotal) over all attribute values in the column. Note that an aggregation type is set in the 'Select Columns' tab.
On the 'Select Rollups' tab, you can decide which of the non-aggregated columns you want to roll up to create partial aggregations.

The figure below shows a report on computational usage for a project over a few days, generated with the 'Day', 'Host Name', 'Hours Charged' (aggregated with sum) and 'Premium Hours' (aggregated with sum) columns. The first 18 rows are the usage data generated with 3 filters (the start and end dates, and the project, in this example). As shown above, a rollup is set for the 'Host Name' column, to show in essence the daily usage, regardless of where individual jobs ran. The bottom 3 rows are the result of the rollup. You can sort in the chronological order by clicking on the 'Day' column header.
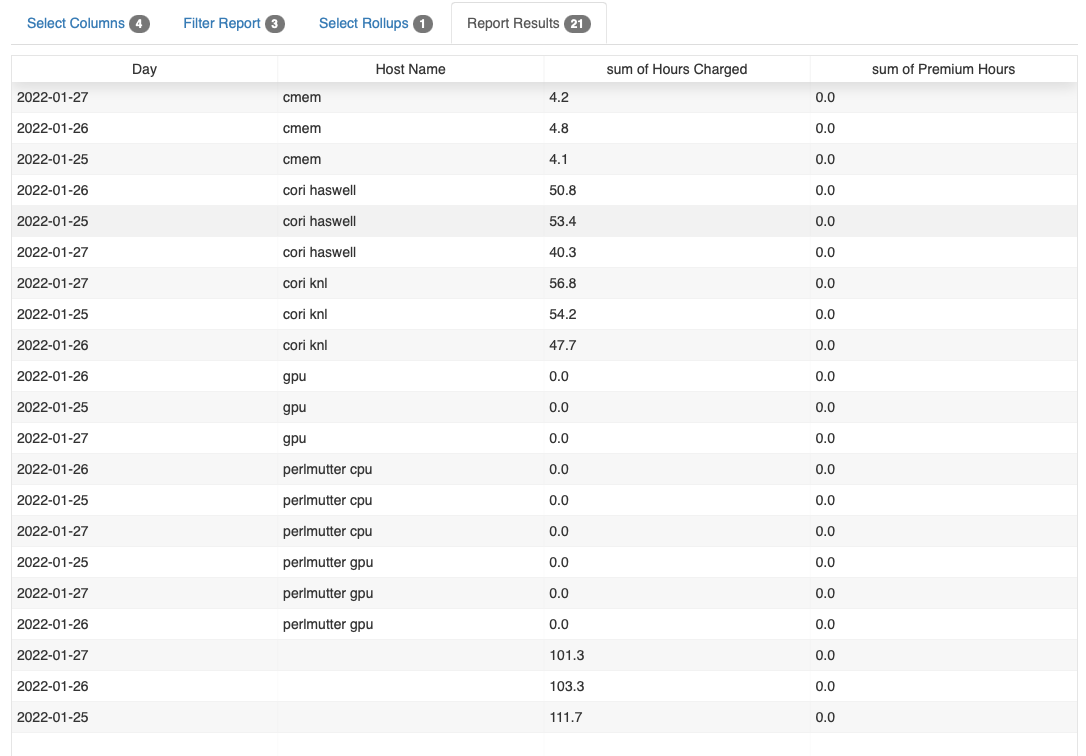
Multiple columns can be set for rollups. The result will also include intermediate results from progressive rollups over one more columns at a time, starting from the last one. The number in the 'Select Rollups' tab is the number of the rollup columns.
Report Results
Click the 'Run Report' button to generate results that satisfy the specified conditions. You can see the search result by selecting the 'Report Results' tab.
The number in the 'Report Results' tab is the number of the generated data items (rows).
Types of reports
Superset Reports
This menu is for generating dashboards using Apache Superset, a modern data exploration and data visualization platform that works with various data sources. For info on creating dashboards, you can go to its documentation page.
Daily Compute Activity
This report shows computational usage for a specified date, or over a time period that is defined with dates.
Monthly Compute Activity
This is similar to the 'Daily Compute Activity' above, but the report period is based on a calendar month.
Jobs 
This report shows details about user jobs. Available search filters are 'Job', 'User', 'Project', 'Program', 'Host Name', 'Partition', 'QOS', 'Submit', 'Start', 'End', 'Wait Time', 'Elapsed Secs', 'CPUs', 'Nodes Allocated', 'Hours Charged', 'Raw Hours', 'Machine Hours', 'Charge Factor', 'Reservation ID', and 'Has Transfer'.

If you click the job ID link, you will see a summary for the job, as explained above.
Job Updates
This is reserved only for NERSC staff for administrative work.
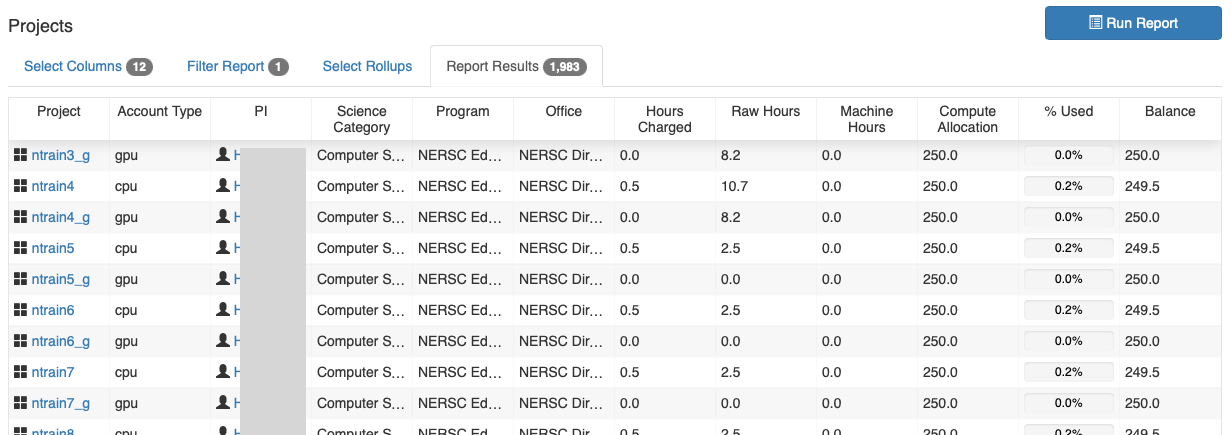
Projects 
This report shows details such as the CPU account name, GPU account name, PI name, allocation amount, CPU/GPU Node Hours charged, balance, etc. for all project accounts.
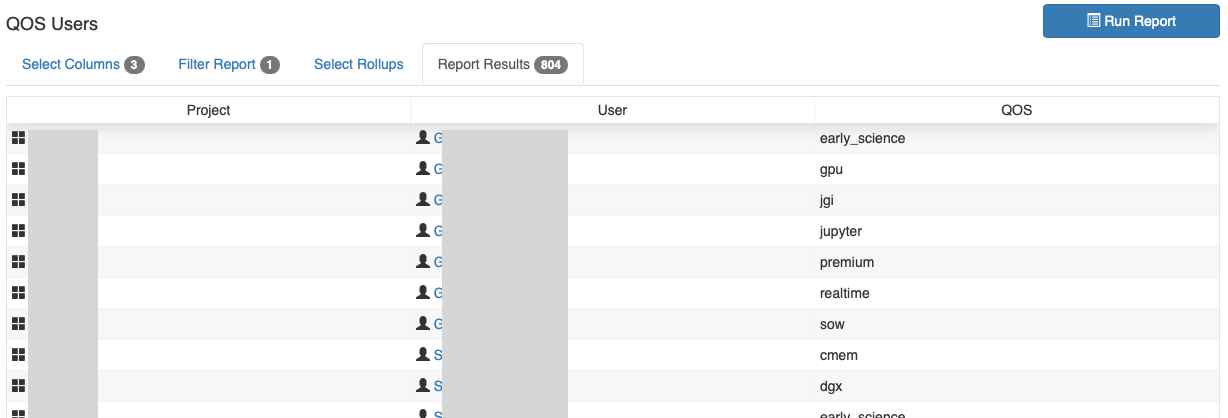
QOS Users
A QOS enables a user to use a certain resource - premium for using the premium queue, realtime_perlmutter for accessing to the realtime QOS on Perlmutter, etc. This menu shows which QOS' users have access to.
Project Directories
This is to show details such as the owner, quotas, usage, etc. about the Community File System (CFS) directories created for projects.

Allocation Transfers
This menu is only for NERSC staff and DOE allocation managers for administrative work.
Server Users
This shows which login servers a user has access to. You can narrow down your search with the 'User', 'User Name', 'Email', and 'Login Server' filters.

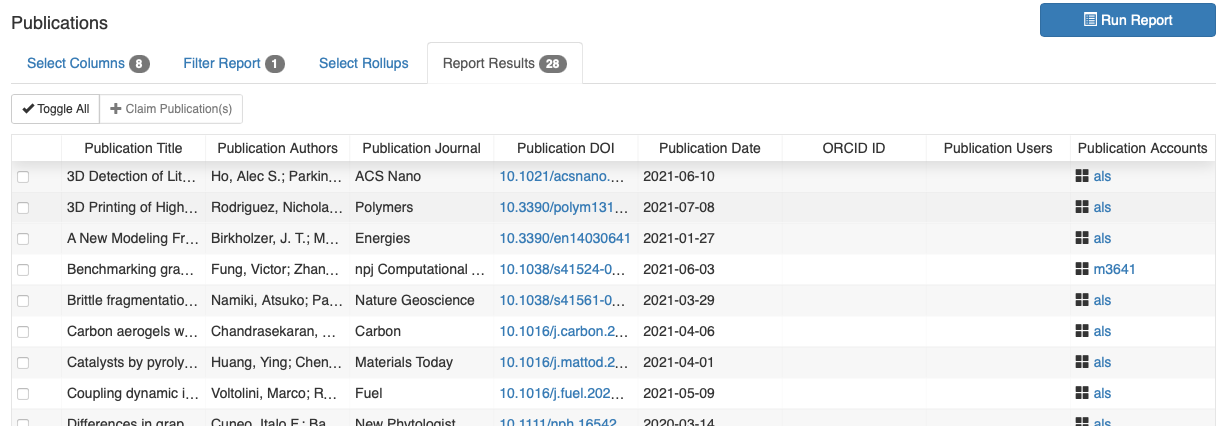
Publications
This menu shows publications linked to NERSC users or projects.
Server Logins
All of NERSC's computational systems are managed by the LDAP protocol. This menu shows LDAP-related information associated with user accounts for various NERSC hosts such as DNs (Distinguished Names), usernames, etc.
Storage Type Quotas
This new utility will be available soon.
Reserves
The display shows the current allocation reserves for various DOE Office of Science Programs and other allocation pools.
Reserves Table
This can create a report based on the allocation reserves explained above (see 'Reserves').
Usage Tracking Report
By default, the display shows the CPU Node Hours charged, machine node hours used and the uniform charge rate plots aggregated over all allocation accounts with respect to time since the start of the current allocation year. You can generate plots for a certain allocation account only, by setting the account name, and then clicking the 'Graph!' button. You can make plots for a certain DOE program/office category or a different allocation pool, too.
![]()
Storage Tracking Report
This is to show the quotas and the aggregated storage usage in CFS and HPSS over time.
![]()
Utilities
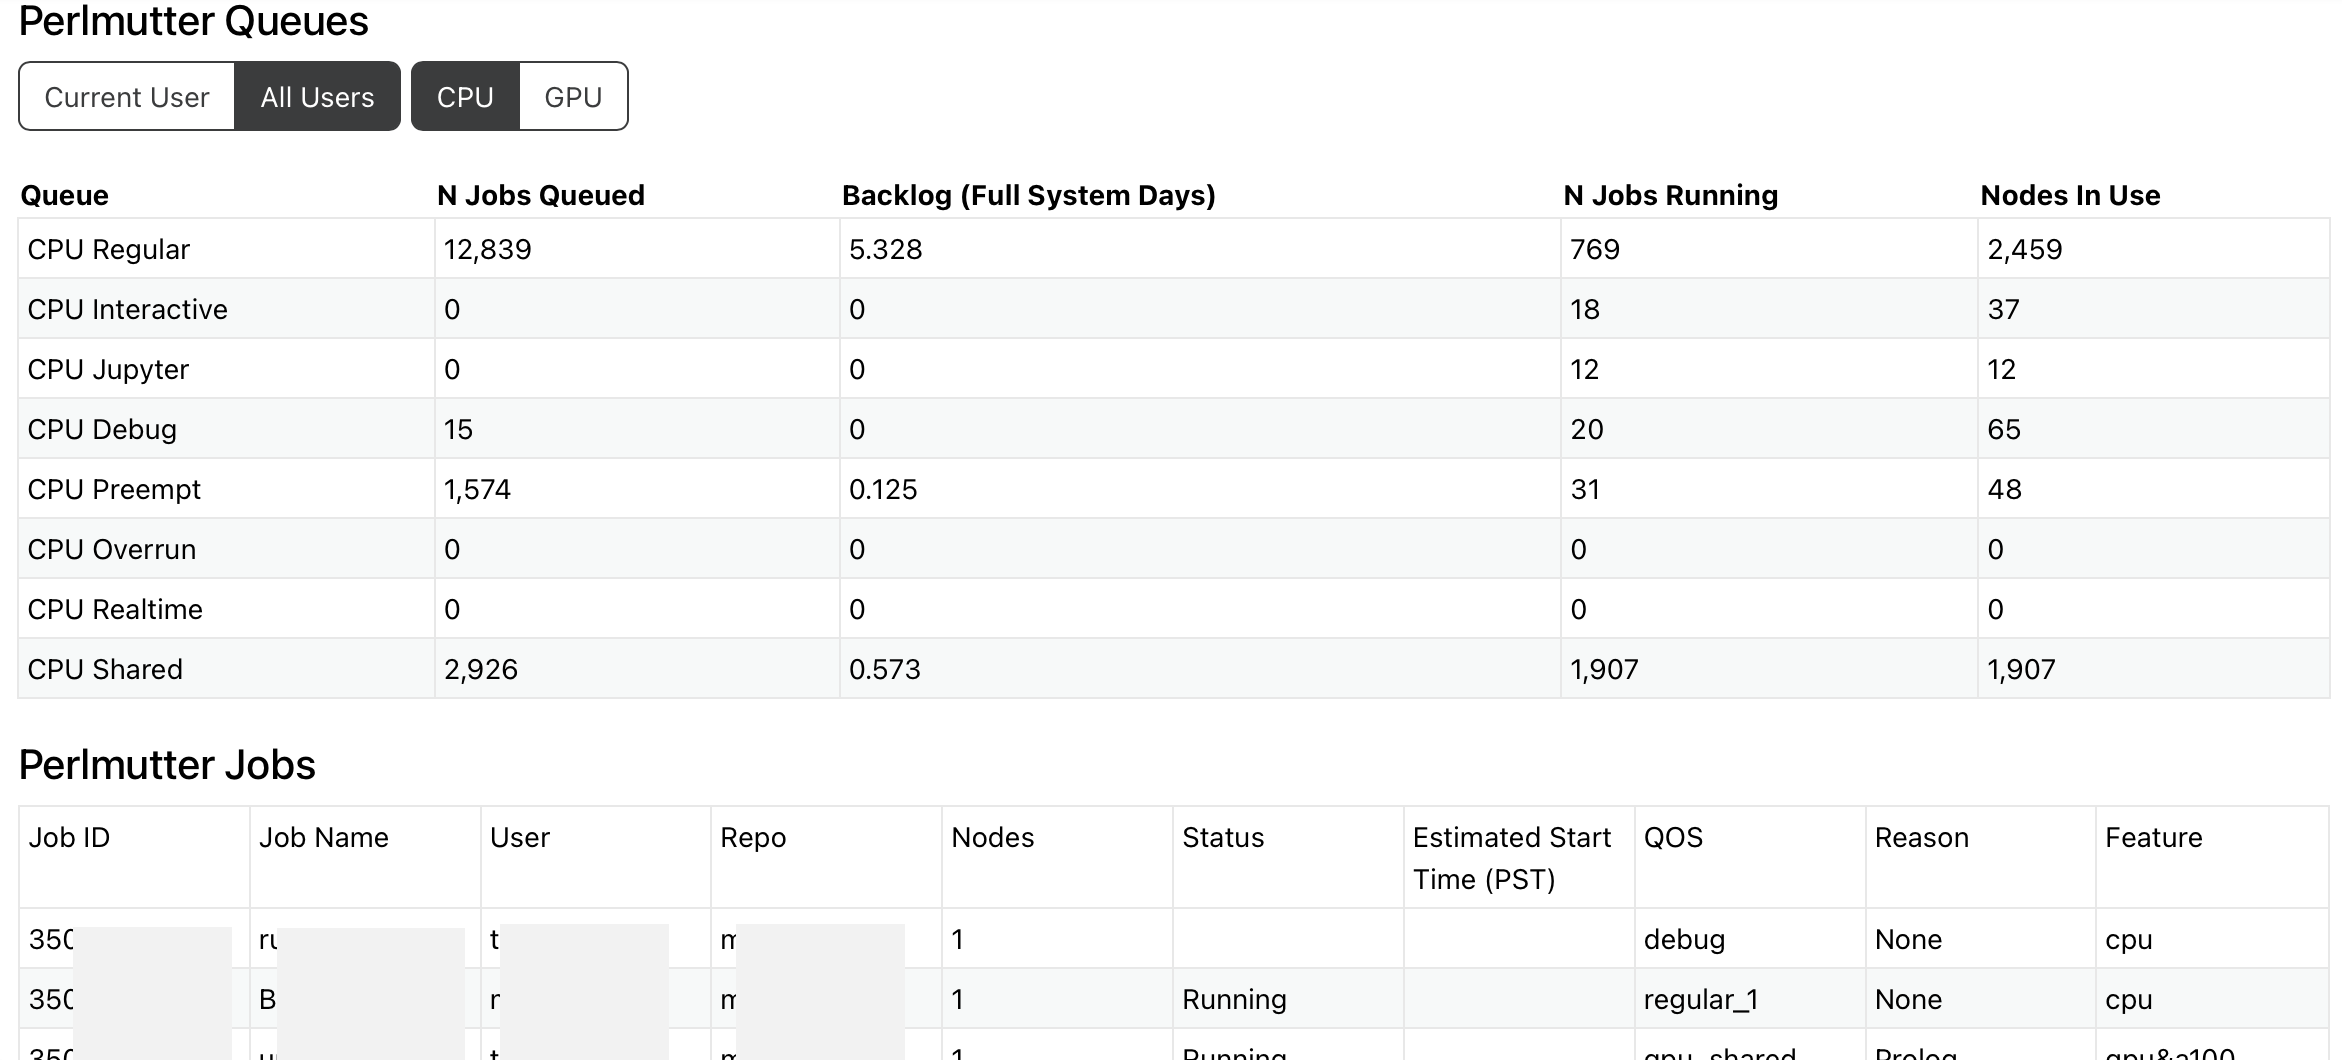
Perlmutter Queues
This menu displays batch jobs currently in the Perlmutter queues. You can select CPU or GPU jobs belonging to your account or all users.
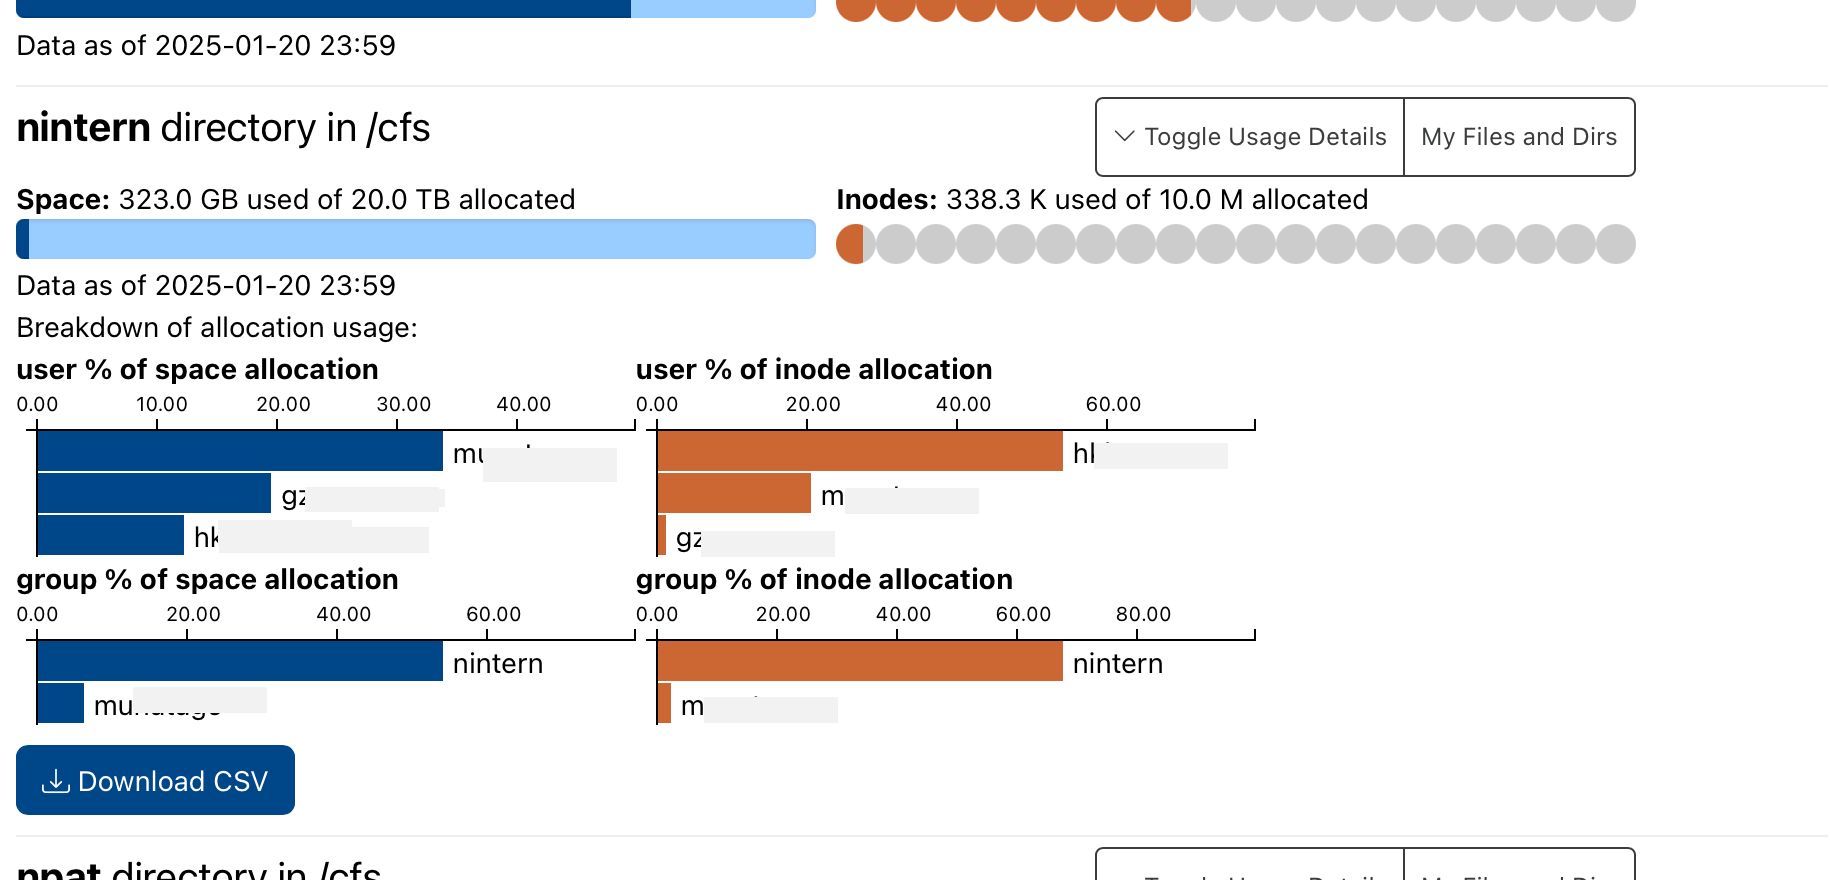
Data Dashboard
This shows graphically disk space and inode usage for directories which you have access. Click 'Toggle Usage Details' for a breakdown of space and inode usage by users and file groups. Click 'My Files and Dirs' to get plots for biggest files and directories which are also color-coded by access mode ('Access Time' vs. 'Change Time') to give you an interesting perspective on file and directory usage.
Jobscript Generator
This tool generates a batch script template which also realizes specific process and thread binding configurations. Enter the machine name for a batch job and a run configuration such as the number of compute nodes to be requested, the number of MPI processes and the number of threads per process, etc. Then, will get a batch job script template for the job.
File Browser
This page can list files in your $HOME, Perlmutter scratch directory, and CFS directories of your projects. You can upload or download files, too.
Announcements
Here you can find a collection of previous NERSC announcements and weekly emails sent to NERSC users.
My Active Jobs
This shows details about my active batch jobs such as job ID, start time, end time, QoS, nodes, etc. for each job.
Center
Center Status
The menu provides a link to the NERSC Center Status page, showing the current status of NERSC compute systems, file systems, mass storage systems and services; and future and past outage info.
Outage Log
You can find records of the past system outages here. If your job failed unexpectedly, this may be the first place to check it was due to a system outage.
Queues and Wait Times
You can find wait time stats of the processed jobs. If your job doesn't start, you can check here to see if it is due to your selected Slurm run configuration is associated with a long wait time. If so, you can modify the configuration (e.g., aggregating many short jobs into a fewer big jobs) to reduce wait times.
Resources
This section contains links to some popular NERSC resource pages:
- Technical documentation webpage
- NERSC trouble ticket system
- NERSC Jupyter
- Iris Account States Diagram, showing procedures taken for typical NERSC Account Support tasks such as creation of a new user account, adding an account to a project, removal from a project, deactivation of an account, etc.
Settings
The 'Settings' menu found when clicking the hamburger menu has the following items.
Profile
This link brings to your account's Profile page.
Iris Roles
This page shows what your project roles are (e.g., User, PI, ...) and what permissions you have in Iris. The page also contains a table summarizing what kind of permissions are given to different roles in Iris as well as in a project. For example, your project's PI, a PI proxy or a Project Resource Manager can set how much compute time a project member is allowed to use or whether the premium QOS can be used in running batch jobs.
Iris UI Settings 
-
Overlay Menu: When enabled, this will cause the hamburger menu to cover part of the displayed page when it opens. The default is to push the displayed content to the right, which can will push wide list information off of the screen. This setting can be more adaptive to different screen sizes like for a tablet or a phone.
-
Hide Menu: The hamburger Menu will automatically close after you have made a selection from the menu. The default is for the menu to remain open so you see the options all of the time. If you have the menu set to Overlay, you will always have part of the display screen hidden.